More information on the Coastal Structure and Dun Crest Inventory Overtopping interactive map.
More Information The Maine Geological Survey has released a new interactive web map viewer that allows communities, businesses and others along the state's southern coast to manage coastal infrastructure as sea and storm levels rise.
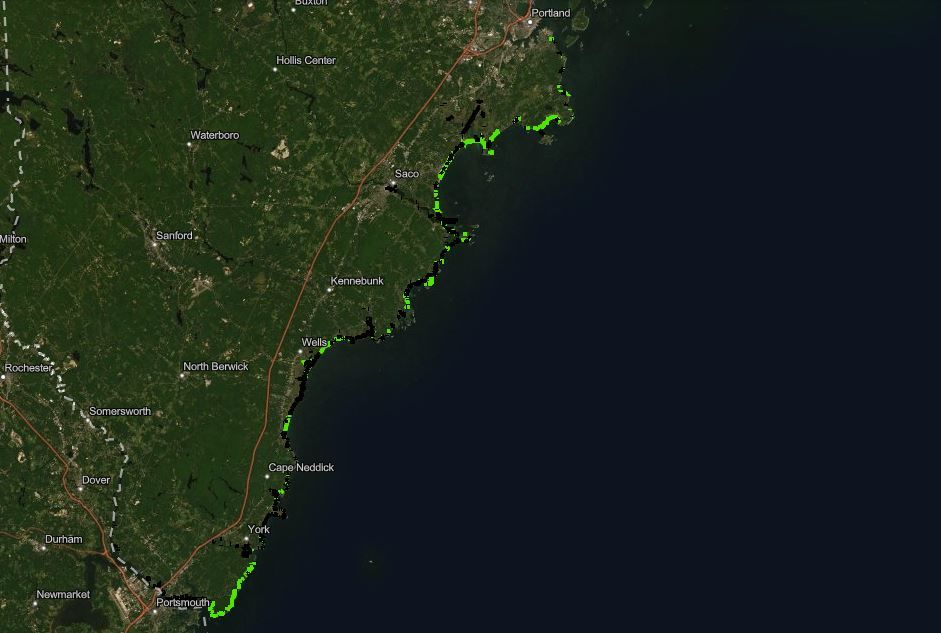
The Coastal Structure and Dune Crest Inventory and Overtopping Potential map covers coastal engineering structures — seawalls, bulkheads and jetties — and sand dune crests from Kittery to South Portland.
The viewer provides an analysis of how vulnerable coastal engineering structures and dunes are to being surmounted by storms. The map displays the relationship between the elevations of existing structures and protective sand dunes in reference to the 100-year base flood elevations from preliminary Federal Emergency Management Agency Flood Insurance Rate Maps, according to a news release from the Maine Geological Survey.
"Understanding this relationship may help guide adaptive management of coastal infrastructure and the pursuit of green infrastructure approaches, such as dune restoration, in response to storms and sea level rise," the release said.
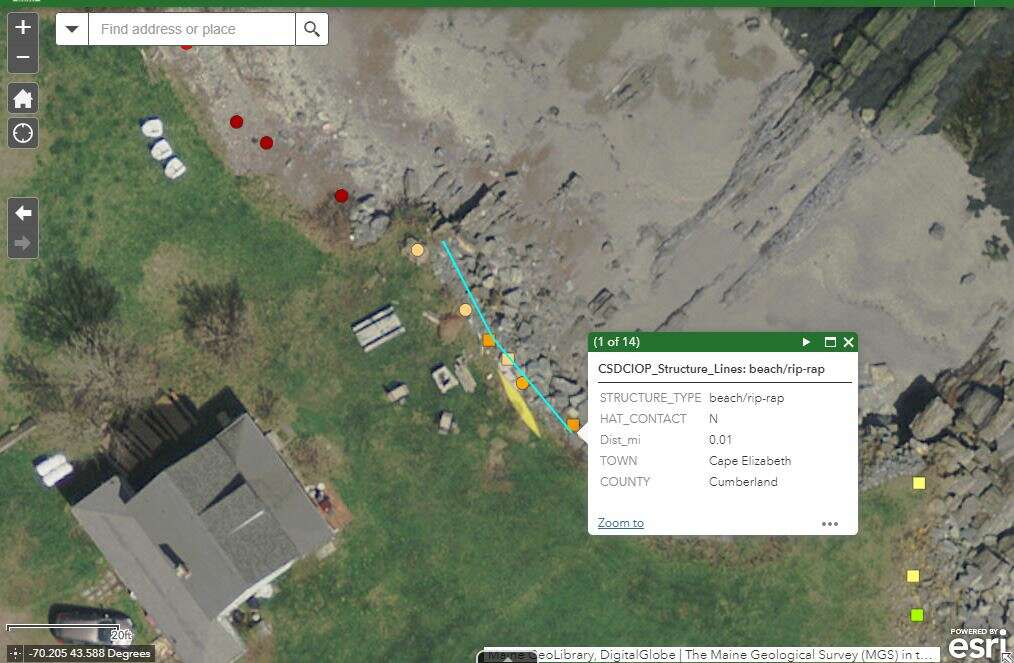
Map users can click on specific areas or features and see the elevations of structures and dunes in relation to FEMA's base flood elevations.
The structure and dune crest map layers can be downloaded as shape files for use in any GIS software to perform further spatial analysis, according to the MGS website.
The Maine Geological Survey, which is part of the Department of Agriculture, Conservation and Forestry, cautions that the map is to help inform decisions at the local, regional and state level, and users should assume responsibility in determining if the data is useful for their purposes. Metadata is included for all of the downloadable layers and should be reviewed for more specifics on how these data were created, MGS said.
Among other information, the new map shows that in the coastal study area from Kittery north to South Portland there is about 511 miles of tidally influenced shoreline. Coastal engineering structures front 68.4 miles — or about 13.4% — of it. Undeveloped dune crests front approximately 31.6 miles — or about 6.2% of the tidally influenced shoreline.
Some other takeaways from the map:
- About 96.4 miles from Kittery to South Portland are “open coast” — they're exposed to dynamic wave action;
- About 28.3 miles (or 29.3%) of that shoreline has dune crests; and
- About 38 miles (or 39.4%) of the shoreline has coastal engineering structures.


0 Comments